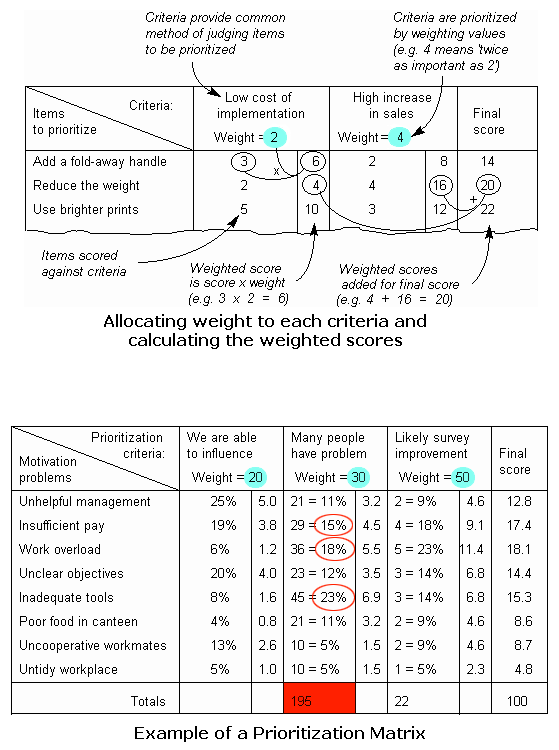
Example of a Prioritization Matrix
The first table below shows you the basic matrix structure and how weight is allocated to each criteria. The second table below demonstrates a survey exercise done by the personnel department to evaluate on overall employees' morale in a company. It uses 100 weighting points between the three criteria. Scoring of problems was done differently for each criterion, but then converted to a percentage before multiplying by the weight. This scheme resulted in final scores that were also percentage figures. Scoring of problems against criteria was done as follows:
- For the criterion of 'We are able to influence', the ability of the personnel department to effect a real change was discussed, and 100 points distributed between problems.
- For the criterion of 'Many people have problem', the actual number of people mentioning this problem in the survey was used and then converted to a percentage.
- For the criterion of 'Likely survey improvement', the improvement in the survey score in these areas if this problem was fully addressed was used and then converted to a percentage.
The figure below shows the Prioritization Matrix. Pay and work overload, as the highest scoring motivational problems, were selected for carrying forward for further investigation. As a result of consequent work in the project, the pay structure for certain grades was revised and training on job scheduling was introduced. In the following year, the survey improved in these areas by 2 and 3 points, respectively.
