About Me
Excel VB Programming (97-2003)
Excel Spreadsheet Formulas
Excel VB.NET Programming
Access Programming (2000-2003)
Material Management
Detailed Capacity Planning
Capacity Requirements Planning (CRP)
It is a process of determining short-range capacity requirements. Capacity Requirements
Planning is a computerized technique for projecting current and future
resource requirements for critical work stations. The functions of CRP
are:
• To test
MPS for feasibility.
• To utilize routings to determine
labor/machine loads.
• If master schedule is feasible, recommends
freezing.
• If master schedule overloads resources, identify
processes that are overscheduled.
Capacity planning actually occurs at two times in the assembly environments. First, it is the Rough-Cut Capacity Planning (RCCP) that is done during the preparation of the Master Production Schedule. Purpose of RCCP is to make a rough check on the feasibility of the MPS (against the availability of operating shifts and labor hours, existing availability of equipments) before making any materials planning and final scheduling decisions. It identifies potential bottleneck operations that may disrupt your master schedule. If the master schedule is not feasible at this stage, it should be adjusted. Any serious capacity problems should be relayed back to the aggregate production plan. Once a feasible master schedule is confirmed, we continue with the short-range scheduling of production.
The master schedule is exploded through the MRP using bills-of-material, producing a set of recommended planned orders, for in-house production, as well as orders to suppliers for any bought-out material items, and indicate, based on the master schedule and the associated material buy plan, which items should be replenished first and the due dates. It can also include rescheduling of the open orders.
In a job shop situation, using the saved routings of the various items, these planned-orders are converted to requirements (for example, in machine and labor hours) at the various work centers. In this way the required capacity for each work center in each time period is determined. As MRP assumes infinite capacity, and in the general approach of infinite loading, capacity constraints are ignored in developing the capacity profile. In finite loading, the master schedule is developed within the capacity constraints at all work centers.
Capacity
constraints
Organizations operate below their maximum available capacity, either
because there is insufficient demand to fill the capacity, or it is
deliberately done so that the operation can response quickly to every
unplanned increase in demand. Often, though, organizations find some
parts of their production operating below capacity while other component
parts have production at their capacity ceiling. It is the parts of
production that are operating at maximum capacity which constitute the
capacity constraint for the whole
production operation. Alternative long-term capacity strategies would be
to add in new production equipments, adding new work shifts, continuous
process improvement to reduce cycle times, subcontract out some
production volume, or to improve on forecast accuracy with better
forecasting methods if actual demand has shown to consistently lag
behind forecast.
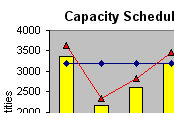
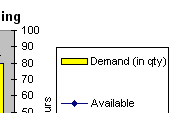
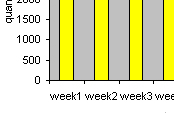
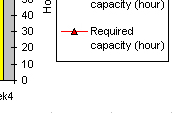
Figure 15.1 below gives a simple illustration of capacity planning. Assuming in a wheel-axle assembly factory, a particular gear sub-assembly production output is the constraint bottleneck. This line runs on 2 eight-hour shift, 5 days/week, that's an available capacity of 80 hours per week. As you can see in Table 15.1 there is a required capacity short on week 1 and week 4, more than the 80 hours/week available capacity can cope with.
A straightforward solution is simply to shift some week 4 production backward to week 2 and week 3. This is necessary to maximize the available capacity and resources, so that no overtime is planned on week 4, customer orders promised will be shipped on time, and inventory turnarounds better are will be more balanced over the periods. What happens if this gear sub-assembly has 20 other BOM component parts that assembled into it? You would have to revise the master schedule and re-run MRP. Let's say in week 1, production cannot be shifted earlier. Possible solutions would be: to schedule overtime work in week 1, if safety stock, if any is insufficient to support demand; subcontract out some production volume in week 1; use alternate routing if possible. Revise the master schedule only as a last resort if all options failed, then re-run MRP for follow-on materials planning.
| Hours/shift: | 8 |
|
||||||||
| no. of shifts: | 2 | |||||||||
| Work days/week: | 5 | |||||||||
| Gross production rate (qty/hr) | 37 | |||||||||
|
Period: |
week1 | week2 | week3 | week4 | ||||||
| Demand (in qty) | 3370 | 2150 | 2600 | 3200 | ||||||
| Available capacity (hour) | 80 | 80 | 80 | 80 | ||||||
| Required capacity (hour) | 91.1 | 58.1 | 70.3 | 86.5 | ||||||
|
Figure 15.1 scheduling capacity to meet weekly demand |
||||||||||
| Table 15.1 scheduling production capacity |
|
|||||||||
You can download the worksheet example here.
Balancing
capacity planning and demand
How do you plan and control on the issues of capacity have significant
impact on the other aspects of the whole operation. Below are the facts
you may want to take into account:
• planning
capacity levels in excess of demand means capacity under-utilization,
and therefore gives higher units cost of production.
• capacity levels higher than demand at any time ensure that demand is
satisfied, no revenue lost, but that also mean funding excess inventory
cost.
• some amount of safety stock that are provided from surplus capacity,
would enhance service level in event of demand increase from customers.
• planning large increase in capacity levels by hiring new staff, will
jeopardize quality of goods in the short-run if training is not
adequately done.
• the closer you plan required capacity to firm demand curve, the less
you will be able to cope with unexpected disruptions and the less
dependable of the deliveries of your goods and services to customers.
• planning capacity levels with view of cost minimization important
especially for price-sensitive customers and competitive markets.
Steps to
be taken in capacity planning and control
Because in reality demand forecast are
sometimes unlikely to be constant, planners want to make sure they have
enough quantitative data to analyze and to decide on what mix of
capacity to meet such demand. Before any capacity decisions are taken, a
sequence of planning steps must be followed in the following orders:
1. measure
the aggregate demand and capacity levels for the planning period
2. identify the alternative and viable capacity plans which can response
well to demand fluctuations
3. choose the most appropriate capacity plan
In the next
few sections that follow, I will explain on the steps in setting
capacity levels over the short and medium terms in aggregate terms. By
"aggregate" I mean making overall broad capacity decisions by grouping
all the products and services together, and not discriminate between the
detail of the individual products and services. This may mean some
degree of approximation, especially if the products mix varies
significantly. However, the objective is to reconcile, at a general and
aggregate level, between overall capacity and demand, to enable decision
making on total required and available capacity in work shift hours,
labor hours and machine hours.
Measuring
capacity and demand
Sales forecast that comes in as dollars or quantities term need to be
translated into same units of capacity (for example, machine hours per
month, labor hours per week, quantities of material need, tooling
required, space required, etc).
If the nature of your products have some festive demand seasonality, or any of your raw materials have supply seasonality, supply problems due to economic crisis that may cause some expected price hike or foreseeable shortages, you may want to make appropriate capacity adjustments and implement measurement on safety stock replenishment and reorder strategies.
In reality the line cannot be run continuously at its maximum Design Capacity because of the need for line maintenance, changeover, stoppages, loading, etc. What remains, after such loss times are accounted for, are called the Effective Capacity. The Actual Output of production in most cases, will be lower than the Effective Capacity owing to parts reject rate, machine breakdowns, labor absenteeism, human fatigue, etc The measurement ratio of the actual production output to its design capacity is called Utilization. The ratio of the actual output achieved to effective capacity is called Efficiency. They are expressed as formulas below:
|
Utilization |
= |
Actual Output |
Efficiency |
= |
Actual Output | |
| Design Capacity | Effective Capacity |
Considering this example below in a manufacturing line with the known
operating variables, including design capacity, planned and the
unplanned lost production down times. You can determine the operation's
utilization and efficiency factors based on the above formulas. My
worksheet is
here.
| Hours/shift | 8 | ||
| no. of shifts | 3 | ||
| Work days/week | 6 | ||
| Design capacity (qty/minute) | 1 | ||
| Design capacity (hours/week) | 144 | ||
| Design capacity (qty/week) | 8640 | ||
| Last week actual output (qty) | 7636 | ||
| Last week total lost time: | (Minutes) | (Hours) | |
| regular preventive maintenance | 135 | 2.25 |
Unavoidable production lost time (planned occurrences) |
| setup changeover | 90 | 1.5 | |
| quality sampling inspection | 162 | 2.7 | |
| change shift time | 90 | 1.5 | |
| rest time | 270 | 4.5 | |
| Sub-Total: | 747 | 12.45 | |
| Effective Capacity: | 7893 | 131.55 | |
| machine breakdown | 180 | 3 |
Avoidable production lost time (unplanned occurrences) |
| labor shortages | 108 | 1.8 | |
| material stockouts | 27 | 0.45 | |
| parts failure investigation | 117 | 1.95 | |
| waiting for material | 81 | 1.35 | |
| Sub-Total: | 513 | 8.55 | |
| Actual Output: | 7380 | 123 | |
| Utilization =123/144 = | 85.4% | ||
| Efficiency =123/131.6 = | 93.5% | ||
Table 15.2 determining
capacity utilization and efficiency factors
Alternative capacity plans
There are three options
that can be considered for coping with the demand fluctuations -
Level Capacity plan, Chase-Demand plan, and Match-Demand plan.
In practice, there is no one single that might work for all
situations but you will have to adopt a mix of plans.
Level
Capacity Plan
In level capacity plan, capacity is set at a
uniform level or a constant gradient line throughout the planning
horizon, disregarding the fluctuations in forecast demand. This means
that with the same number of workers operating the same processes, and
with no problem in material supply, it is able to produce the same
aggregate output in each period. See the examples in
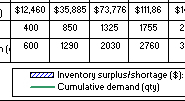
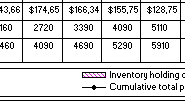
Figure 15.3 where
level capacity plan exceeds forecast demand at each of the planning
period, and in
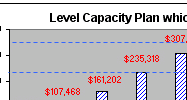
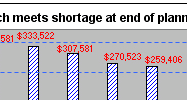
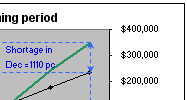
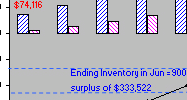
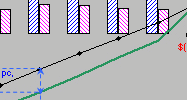
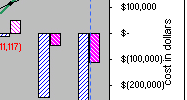
Figure 15.4
level capacity plan uniformly
exceeds forecast demand but will meet shortage towards the end of
planning periods.
Low capacity utilization can make level capacity plan prohibitively expensive in many manufacturing and after-sales operations, but may be considered as necessary when opportunity costs of individual lost sales are high, or when the new products are at the strategic stage of market penetration. You can set the capacity somewhat below the peak forecast demand level in order to able to reduce some degree of under-utilization. However, in periods when demand is expected to exceed planned level capacity, you could be putting your customer service level at risk.
Chase-Demand Plan
Chase demand plan is one which attempts to
adjust and match capacity close to the varying levels of forecast demand
at the each period. This is a more difficult approach than a level
capacity plan, as different numbers of workers, more labor hours, more
production lost times, and even rescheduling on the different number of
equipments may be required in each period. For this reason, this option
plan may not look attractive to those manufacturing operations that are
capital-intensive and which manufacture standard industry-use,
non-perishable products. Also, there are costs that will increase in
association with changing capacity levels. For example, costs incurred
from borrowing capital, hiring staff, training, insurance, storage,
materials obsolescence, pilferage, etc. The benefit of chase demand plan
is that it avoids wasteful provision of excess workers and excess
working hours that occurs with a level capacity plan, and able to
satisfy customer demand throughout the planned period.
The various
means of adjusting the capacity are:
• varying the amount of overtime work used.
• transferring staff to work on other work centers when idle time
is long.
• employing part-time workers.
• varying the workforce size - "hire and fire". Of course, there
are cost and ethical implications to be considered.
• sub-contracting out
some capacity volume in the periods of high demand.
Manage-Demand Plan
This approach of demand management is a medium-term capacity management
that attempts to change or influence demand to fit the available
capacity. A common example is giving promotion discounts for the
products to increase the demand - the marketing gimmick used to
stimulate off-peak demand and to constrain peak demand in order to
smooth the demand curve.
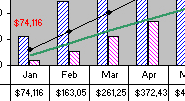
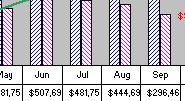
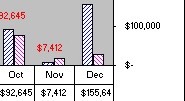
The fact that most operations are required simultaneously to reduce inventory level and costs, and yet to also provide a responsive and customer-oriented approach at all times, a mix plan would be seen as more practical. See an example of the mix plans in Figure 15.5 where instead of having a constant gradient curve, the mix plan shows varying gradient representing the production rate at each different period.
|
Per Day |
Per Shift |
Per Hour |
||||||||||
| Inventory holding cost per unit qty | $ 6.23 | $ 2.08 | $ 0.26 |
In house production standard cost / unit |
$ 370.58 | |||||||
| Target production (qty) | 30 | 10 | 1.25 |
Outsourced production standard cost / unit |
$ 400.45 | |||||||
| Jan | Feb | Mar | Apr | May | Jun | Jul | Aug | Sep | Oct | Nov | Dec | |
| Demand (qty) | 400 | 450 | 475 | 430 | 405 | 560 | 670 | 700 | 1020 | 1250 | 850 | 200 |
| Cumulative demand (qty) | 400 | 850 | 1325 | 1755 | 2160 | 2720 | 3390 | 4090 | 5110 | 6360 | 7210 | 7410 |
| Productive days | 20 | 18 | 20.67 | 21 | 20 | 21 | 20 | 20 | 20.67 | 23.33 | 20.67 | 20 |
| Productive shifts | 60 | 54 | 62 | 63 | 60 | 63 | 60 | 60 | 62 | 70 | 62 | 60 |
| Productive hours | 480 | 432 | 496 | 504 | 480 | 504 | 480 | 480 | 496 | 560 | 496 | 480 |
| Cumulative productive hours | 480 | 912 | 1408 | 1912 | 2392 | 2896 | 3376 | 3856 | 4352 | 4912 | 5408 | 5888 |
| Demand (qty/productive day) | 20.000 | 25.000 | 22.984 | 20.476 | 20.250 | 26.667 | 33.500 | 35.000 | 49.355 | 53.571 | 41.129 | 10.000 |
| Demand (qty/productive shift) | 6.667 | 8.333 | 7.661 | 6.825 | 6.750 | 8.889 | 11.167 | 11.667 | 16.452 | 17.857 | 13.710 | 3.333 |
| Demand (qty/productive hour) | 0.833 | 1.042 | 0.958 | 0.853 | 0.844 | 1.111 | 1.396 | 1.458 | 2.056 | 2.232 | 1.714 | 0.417 |
| Cumulative target in-house production (qty) | 600 | 1140 | 1760 | 2390 | 2990 | 3620 | 4220 | 4820 | 5440 | 6140 | 6760 | 7360 |
| Outsourced production (qty) | 0 | 150 | 120 | 100 | 100 | 0 | 0 | 0 | 0 | 0 | 0 | 0 |
| Cumulative total planned production (qty) | 600 | 1290 | 2030 | 2760 | 3460 | 4090 | 4690 | 5290 | 5910 | 6610 | 7230 | 7830 |
| Ending inventory (qty) | 200 | 440 | 705 | 1005 | 1300 | 1370 | 1300 | 1200 | 800 | 250 | 20 | 420 |
| Average inventory (qty) | 100 | 320 | 573 | 855 | 1153 | 1335 | 1335 | 1250 | 1000 | 525 | 135 | 220 |
| Inventory holding cost for month ($) | $12,460 | $ 35,885 | $ 73,776 | $111,860 | $143,664 | $174,658 | $166,341 | $155,750 | $128,753 | $76,317 | $17,382 | $ 27,412 |
| Inventory surplus/shortage ($) | $74,116 | $163,055 | $261,259 | $372,433 | $481,754 | $507,695 | $481,754 | $444,696 | $296,464 | $92,645 | $7,412 | $155,644 |
| Inventory holding cost for the year: $1,124,257 | ||||||||||||
Table 15.3 level capacity planning
 |
 |
 |
 |
 |
 |
 |
 |
 |
 |
 |
 |
 |
 |
 |
 |
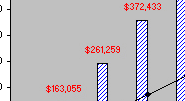
Figure 15.3 level capacity plan that exceeds forecast demand over the entire planning periods
| Per Day |
Per Shift |
Per Hour |
||||||||||
| Inventory holding cost per unit qty: | $ 6.23 | $2.08 | $ 0.26 |
In-house production standard cost / unit: |
$ 370.58 | |||||||
| Target production (qty): | 30 | 10 | 1.25 |
Outsourced production standard cost / unit: |
$ 400.45 | |||||||
| Jan | Feb | Mar | Apr | May | Jun | Jul | Aug | Sep | Oct | Nov | Dec | |
| Demand (qty) | 400 | 450 | 475 | 430 | 405 | 560 | 670 | 700 | 650 | 1430 | 1250 | 1050 |
| Cumulative demand (qty) | 400 | 850 | 1325 | 1755 | 2160 | 2720 | 3390 | 4090 | 4740 | 6170 | 7420 | 8470 |
| Productive days | 20 | 18 | 20.67 | 21 | 20 | 21 | 20 | 20 | 20.67 | 23.33 | 20.67 | 20 |
| Productive shifts | 60 | 54 | 62 | 63 | 60 | 63 | 60 | 60 | 62 | 70 | 62 | 60 |
| Productive hours | 480 | 432 | 496 | 504 | 480 | 504 | 480 | 480 | 496 | 560 | 496 | 480 |
| Cumulative productive hours | 480 | 912 | 1408 | 1912 | 2392 | 2896 | 3376 | 3856 | 4352 | 4912 | 5408 | 5888 |
| Demand (qty/productive day) | 20.000 | 25.000 | 22.984 | 20.476 | 20.250 | 26.667 | 33.500 | 35.000 | 31.452 | 61.286 | 60.484 | 52.500 |
| Demand (qty/productive shift) | 6.667 | 8.333 | 7.661 | 6.825 | 6.750 | 8.889 | 11.167 | 11.667 | 10.484 | 20.429 | 20.161 | 17.500 |
| Demand (qty/productive hour) | 0.833 | 1.042 | 0.958 | 0.853 | 0.844 | 1.111 | 1.396 | 1.458 | 1.310 | 2.554 | 2.520 | 2.188 |
| Cumulative target in-house production (qty) | 600 | 1140 | 1760 | 2390 | 2990 | 3620 | 4220 | 4820 | 5440 | 6140 | 6760 | 7360 |
| Outsourced production (qty) | 0 | 0 | 0 | 0 | 0 | 0 | 0 | 0 | 0 | 0 | 0 | 0 |
| Cumulative total planned production (qty) | 600 | 1140 | 1760 | 2390 | 2990 | 3620 | 4220 | 4820 | 5440 | 6140 | 6760 | 7360 |
| Ending inventory (qty) | 200 | 290 | 435 | 635 | 830 | 900 | 830 | 730 | 700 | -30 | -660 | -1110 |
| Average inventory (qty) | 100 | 245 | 363 | 535 | 733 | 865 | 865 | 780 | 715 | 335 | -345 | -885 |
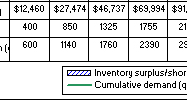
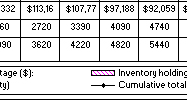
| Inventory holding cost for month ($) | $12,460 | $27,474 | $46,737 | $69,994 | $ 91,332 | $113,168 | $107,779 | $ 97,188 | $ 92,059 | $ 48,698 | $ (44,420) | $(110,271) |
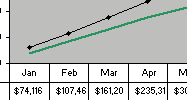
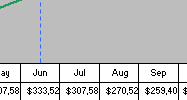
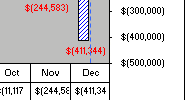
| Inventory surplus/shortage ($): | $74,116 | $107,468 | $161,202 | $235,318 | $307,581 | $333,522 | $307,581 | $270,523 | $259,406 | $ (11,117) | $ (244,583) | $(411,344) |
| Inventory holding cost for the year: $552,198 | ||||||||||||
Table 15.4 level capacity planning
 |
 |
 |
 |
 |
 |
 |
 |
 |
 |
 |
 |
 |
 |
 |
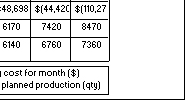 |
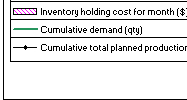
Figure 15.4 level capacity plan that uniformly exceeds forecast demand but will meet shortage towards end of the planning periods
|
Per Day |
Per Shift |
Per Hour |
||||||||||
| Inventory holding cost per unit qty: | $ 6.23 | $ 2.08 | $ 0.26 | |||||||||
| PLAN A |
Per Day |
Per Shift |
Per Hour |
|||||||||
| Jan - Jun Target production (qty): | 52 | 17.33 | 2.17 | In-house production standard cost / unit: | $ 370.58 | |||||||
| Jul - Dec Target production (qty): | 105 | 35.00 | 4.38 | Outsourced production standard cost / unit: | $ 390.45 | |||||||
| PLAN B |
Per Day |
Per Shift |
Per Hour |
|||||||||
| Jan - Feb Target production (qty): | 65 | 21.67 | 2.71 | Plan A cost of capacity change:52/day to 105/day | $ 550,000 | |||||||
| Mar - Jul Target production (qty): | 105 | 35.00 | 4.38 | Plan B cost of capacity change:65/day to 105/day | $ 30,000 | |||||||
| Aug - Dec Target production (qty): | 65 | 21.67 | 2.71 | Plan B cost of capacity chang:105/day to 65/day | $ 20,000 | |||||||
| Jan | Feb | Mar | Apr | May | Jun | Jul | Aug | Sep | Oct | Nov | Dec | |
| Demand (qty) | 400 | 640 | 760 | 830 | 1020 | 1500 | 1980 | 2220 | 2660 | 3850 | 4000 | 2450 |
| Cumulative demand (qty) | 400 | 1040 | 1800 | 2630 | 3650 | 5150 | 7130 | 9350 | 12010 | 15860 | 19860 | 22310 |
| CAPACITY PLAN A | Jan | Feb | Mar | Apr | May | Jun | Jul | Aug | Sep | Oct | Nov | Dec |
| Productive days | 19 | 18 | 17 | 16 | 19 | 20 | 18 | 20.667 | 24.667 | 25.333 | 27 | 15 |
| Productive shifts | 57 | 54 | 51 | 48 | 57 | 60 | 54 | 62 | 74 | 76 | 81 | 45 |
| Productive hours | 456 | 432 | 408.00 | 384 | 456 | 480 | 432 | 496 | 592 | 608 | 648.00 | 360 |
| Cumulative productive hours | 456 | 888 | 1296 | 1680 | 2136 | 2616 | 3048 | 3544 | 4136 | 4744 | 5392 | 5752 |
| Demand (qty/productive day) | 21.053 | 35.556 | 44.706 | 51.875 | 53.684 | 75.000 | 110.000 | 107.419 | 107.838 | 151.974 | 148.148 | 163.333 |
| Demand (qty/productive shift) | 7.018 | 11.852 | 14.902 | 17.292 | 17.895 | 25.000 | 36.667 | 35.806 | 35.946 | 50.658 | 49.383 | 54.444 |
| Demand (qty/productive hour) | 0.877 | 1.481 | 1.863 | 2.161 | 2.237 | 3.125 | 4.583 | 4.476 | 4.493 | 6.332 | 6.173 | 6.806 |
| Cumulative target in-house production | 988 | 1924 | 2808 | 3640 | 4628 | 5668 | 7558 | 9728 | 12318 | 14978 | 17813 | 19388 |
| Outsourced production | 0 | 0 | 0 | 0 | 0 | 0 | 0 | 0 | 400 | 1000 | 1500 | 300 |
| Plan A cumulative planned production | 988 | 1924 | 2808 | 3640 | 4628 | 5668 | 7558 | 9728 | 12718 | 16378 | 20713 | 22588 |
| Ending inventory (qty) | 588 | 884 | 1008 | 1010 | 978 | 518 | 428 | 378 | 708 | 518 | 853 | 278 |
| Average inventory (qty) | 294 | 736 | 946 | 1009 | 994 | 748 | 473 | 403 | 543 | 613 | 686 | 566 |
| Inventory holding cost for month ($) | $ 34,801 | $ 82,535 | $100,191 | $100,577 | $117,660 | $ 93,201 | $ 53,042 | $ 51,888 | $ 83,445 | $ 96,748 | $115,392 | $ 52,893 |
| Cumulative inventory holding cost ($) | $ 34,801 | $117,336 | $217,527 | $318,104 | $435,764 | $528,964 | $582,007 | $633,894 | $717,339 | $814,087 | $929,479 | $982,371 |
| Inventory surplus/shortage for month ($) | $217,901 | $327,593 | $373,545 | $374,286 | $362,427 | $191,960 | $158,608 | $140,079 | $262,371 | $191,960 | $316,105 | $103,021 |
| Total Cost = Inventory holding cost for the year + Cost of capacity change = $1,532,371 | ||||||||||||
| CAPACITY PLAN B | Jan | Feb | Mar | Apr | May | Jun | Jul | Aug | Sep | Oct | Nov | Dec |
| Productive days | 25 | 20 | 13 | 13 | 13 | 13 | 13 | 18 | 19 | 22 | 25 | 20 |
| Productive shifts | 75 | 60 | 39 | 39 | 39 | 39 | 39 | 54 | 57 | 66 | 75 | 60 |
| Productive hours | 600 | 480 | 312.00 | 312 | 312 | 312 | 312 | 432 | 456 | 528 | 600 | 480 |
| Cumulative productive hours | 600 | 1080 | 1392 | 1704 | 2016 | 2328 | 2640 | 3072 | 3528 | 4056 | 4656 | 5136 |
| Demand (qty/productive day) | 16.000 | 32.000 | 58.462 | 63.846 | 78.462 | 115.385 | 152.308 | 123.333 | 140.000 | 175.000 | 160.000 | 122.500 |
| Demand (qty/productive shift) | 5.333 | 10.667 | 19.487 | 21.282 | 26.154 | 38.462 | 50.769 | 41.111 | 46.667 | 58.333 | 53.333 | 40.833 |
| Demand (qty/productive hour) | 0.667 | 1.333 | 2.436 | 2.660 | 3.269 | 4.808 | 6.346 | 5.139 | 5.833 | 7.292 | 6.667 | 5.104 |
| Cumulative target in-house production | 1625 | 2925 | 4290 | 5655 | 7020 | 8385 | 9750 | 10920 | 12155 | 13585 | 15210 | 16510 |
| Outsourced production | 0 | 0 | 0 | 0 | 0 | 0 | 0 | 300 | 1300 | 1700 | 3000 | 0 |
| Plan B cumulative planned production | 1625 | 2925 | 4290 | 5655 | 7020 | 8385 | 9750 | 11220 | 13755 | 16885 | 21510 | 22810 |
| Ending inventory (qty) | 1225 | 1885 | 2490 | 3025 | 3370 | 3235 | 2620 | 1870 | 1745 | 1025 | 1650 | 500 |
| Average inventory (qty) | 613 | 1555 | 2188 | 2758 | 3198 | 3303 | 2928 | 2245 | 1808 | 1385 | 1338 | 1075 |
| Inventory holding cost for month ($) | $ 72,561 | $174,378 | $231,731 | $ 274,917 | $ 378,547 | $ 411,554 | $ 328,346 | $ 289,051 | $ 277,841 | $ 218,590 | $ 225,065 | $ 100,459 |
| Cumulative inventory holding cost ($) | $ 72,561 | $246,939 | $478,670 | $ 753,587 | $1,132,134 | $1,543,688 | $1,872,034 | $2,161,085 | $2,438,927 | $2,657,517 | $2,882,582 | $2,983,040 |
| Inventory surplus/shortage for month($) | $453,961 | $698,543 | $922,744 | $1,121,005 | $1,248,855 | $1,198,826 | $ 970,920 | $ 692,985 | $ 646,662 | $ 379,845 | $ 611,457 | $ 185,290 |
| Total Cost = Inventory holding cost for the year + Cost of capacity change = $3,033,040 | ||||||||||||
Table 15.5 Two option plans of demand capacity planning for comparison
 |
 |
 |
 |
 |
 |
 |
 |
 |
 |
 |
 |
 |
 |
 |
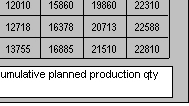 |
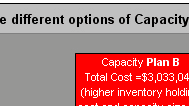
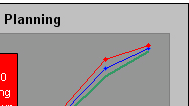
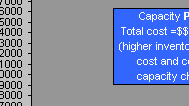
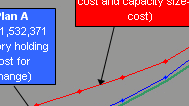
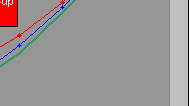
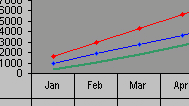
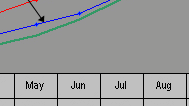
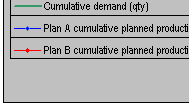
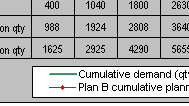
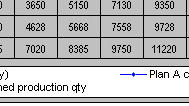
Figure 15.5 comparing two alternatives of mixed capacity plans (Download the worksheet and diagram here)
Choosing
the most appropriate capacity plan
Before you adopt your choice of a capacity plan, you must be aware of
the consequences, possible risks or potential revenue losses that may
occur as a result of your decision of choosing that plan. Figure 15.5
above shows the cumulative graphical representations of the two mix
capacity Plan A and Plan B (varying degrees of level capacity planning
and chase-demand planning) that are plotted against the cumulative
demand forecast line.
An example in Table 15.5, capacity plan A despite having higher cost of capacity change than plan B, has lower inventory holding costs. Because the degree of increasing capacity in plan B (105/65=1.62) is smaller than in plan A (105/52=2.02), thus its costs of changing capacity are smaller than that of plan A. The total cost is the sum of the costs of capacity levels change and inventory holding costs. Figure 15.5 shows both capacity plans on a cumulative basis through the 12 month periods. Because plan A has higher peak/normal ratio of 2.02 than 1.62 of plan B, its capacity change costs are also higher. However, because its planned production levels are closer to forecast levels, plan A has lower inventory holding costs throughout each periods. Plan B has much higher total cumulative inventory carrying costs than plan A ($2,983,040 - $982,371 =$2,000,668) because of planned surplus capacity but then it saves $500,000 in capacity change costs comparing to plan A. In terms of total costs, plan A is cheaper than plan B by $1.5 millions ($3,033,040 - $1,532,371) while still meeting demand for all periods, with no issue of working capital being tied down with excess inventory hold.
Capacity
and Load controls
Capacity control is needed to monitor the level of production output, compares it to the planned levels, and make corrective actions if big deviations are observed. Outline below are the various methods of capacity and production load controls that are used to make adjustment to the capacity or load:
•
Increasing Capacity
–Add extra shifts
–Schedule overtime or weekends
–Add equipment
and/or personnel
• Increasing Load
–Make items
normally purchased or subcontracted
–Release orders early
–Increase lot sizes
–Increase the MPS
• Reducing Capacity
–Eliminate shifts or reduce length of shifts worked
–Reassign
personnel temporarily between work centers
• Reducing Load
–Subcontract work to outside suppliers
–Reduce lot sizes
–Hold
work in production control
–Reduce the MPS
• Redistributing the
Load
–Use alternate work centers
–Use
alternate job routings
–Adjust operation start dates forward or
backward in time
–Revise the MPS
Functional elements in Capacity Requirements Planning
Below section summarizes the important functional elements exist in
capacity requirements planning:
The Input
comprises: -
–Planned order releases (after MRP run)
–Open orders file
–Other
important sources - Rework, Excess scrap, Quality problems
The Routing file contains: -
–Operation identification code
–Operation description
–Planned work center
–Standard setup time
–Standard run time per
unit
–Tooling requirements
Lead Times are: -
–Staging time (time to pick up materials from
store and send to shop floor work center)
–Queue time (time waiting
before operation begins)
–Setup time (time getting ready for
operation)
–Run time (time performing operation)
–Wait time (time waiting after
operation ends)
–Move time (time physically moving between operations)
The
Output
comprises: -
Load Profile for each work center
Load Schedules that
:
-Compares actual labor and machine hours against available
hours
-Offsets schedules between successive stages of
production by lead times
-Provides feasible MPS and
economically loaded work centers
-Promotes system operating
efficiency
Production and Material Controls
It is important to point out the need for detailed production and material controls after the same is done for capacity and load controls. There must be daily or weekly feedback mechanism to allow prompt input to system so that production status and inventory records can be updated accurately and timely. Accurate and prompt feedback on deviations from the plan must be provided by the people in the different functions to the planning team - examples of deviations such as changes in customer input (changes in customer orders and demand forecasts), manufacturing problems (machine breakdowns, expected recovery date, quality problems with particular batch, high failure rate, lower yield, etc), vendor problems (material shortages, equipment breakdowns, can't meet promise dates, etc), inventory inaccuracies (pilferage, data entry errors, short-shipment, wrong-shipment, engineering changes) and other perceived problems. Other daily control measurements include the tracking of production yield, equipment utilization, productivity rate, scrap rate, products serialization and traceability, etc.
The goal of aggregate capacity planning can be met by altering the demand (forecast and orders), by managing supply through control of production output and inventories, or combination of the two. The Chase Demand and Level Capacity production strategies are at the opposite ends of aggregate capacity planning strategies. Each company has to decide whether to adopt a chase, level, or combination of the two capacity planning strategies The costs of carrying inventory to meet future increase in demand and the cost of changing production capacity input or output rates are the two major costs affecting the management of supply in the aggregate capacity planning decision.
Sensitivity
analysis should be performed on the aggregate capacity plan to simulate
the effects of changes in costs and demand.
