About Me
Guestbook
Excel VB Programming (97-2003)
Excel Spreadsheet Formulas
Excel VB.NET Programming
Access Programming (2000-2003)
Material Management
ROUGH CUT CAPACITY PLANNING
The main reason why Rough Cut Capacity Planning (RCCP) is needed because Material Requirements Planning system (MRP) assumes that needed capacity always is available. RCCP helps to identify the key resources (material and personnel shortages, lead time constraints, capacity issues, sole supplier, space, machineries, process bottlenecks that limit output), and to test the feasibility of the supply plan, production plan and master schedule before doing any detailed capacity/material planning. It also helps to initiate action for making mid- to long-term capacity adjustments. (Supply Plan can include purchased parts whereas Production Plan is strictly for production).
In this section, I will show you the RCCP technique using Resource Profile approach. I will not go through other RCCP techniques like the Overall Factors (CPOF) and the Bill Of Labor (BOL) approach, which are least detailed, implicitly assume a Lot-For-Lot policy for setting lot sizes, and are also insensitive to the shifts in product mix. They also do not take Lead-Time Offset into account, but which the Resource Profile approach does. In any event, rough-cut capacity plans should be used only to determine if sufficient capacity exists over broad time frames such as a month or a quarter.
What is RCCP and how
does it work?
Rough Cut Capacity Planning (RCCP) is a rough check to evaluate all the
key resources, to test the validity of MPS, to determine the feasibility
of fulfilling the approved Production Plan that was developed in the
Sales & Operations Planning process. Once the master scheduler
determines that a realistic plan exists, the production plan is then
load into MRP to drive the allocation for all the lower-level materials.
The production plan now translates into discrete part numbers,
quantities and due dates. Because MRP is capacity-insensitive; it
implicitly assumes that sufficient capacity is available to produce
components at the time they're needed, and to avoid being caught by
surprises, RCCP is necessary.
A problem commonly encountered in operating MRP systems is the existence of an Overstated MPS. An overstated master production schedule is one that orders more production to be released than production can complete. An overstated MPS causes raw materials and WIP inventories to increase because more materials are purchased and released to the production floor than they can be completed and shipped before due dates. It also causes a buildup of job queues on the shop floor. Since jobs have to wait to be processed, actual lead times increase, causing ship dates to be missed. As lead times increase, forecast accuracy over the lead-time diminishes because forecasts are more accurate for shorter periods than for longer ones. Thus, an overstated master schedule leads to past-due orders and other problems. Validating the MPS with respect to capacity is an extremely important step in MRP, and is called Rough Cut Capacity Planning. There is no hard and fast rule on the level of detail that should be incorporated in the MPS validation. Some companies used very crude techniques, other used detailed, time-phased, methods.
The Role of RCCP
in Production Planning & Control
Figure 1
shows an overview of the entire production planning and control (PPC)
process under MRP. Capacity management techniques usually are separated
into four categories that represent the four time horizons --
Manufacturing Resource Planning (MRP II), Aggregate Production
Planning, Rough Cut Capacity Planning (RCCP), and Capacity Requirements
Planning (CRP). In any MRP system, the same sequence is to create
a master schedule, use Rough Cut Capacity Planning to verify that the
MPS is feasible, perform the MRP explosion, and send the Planned Order
Release data to Capacity Requirements Planning. The following describes
the role RCCP plays in the overall PPC system:
- To develop an achievable Master Production Schedule.
- T o plan and control priorities and capacities.
- Priority Planning is the process of specifying batch quantities and their start and finish dates for all Supply Orders where procurement and manufacturing are involved.
- Priority Control is making the right things at the right time. It is completely dependent on maintaining a balance between MPS requirements and factory Output rates, in which suppliers delivery performance is vital.
- Capacity planning is the task of determining how much output is needed from factory and from suppliers.
- Capacity control is the comparison between planned levels and actual outputs achieved, and the identification of significant variances above or below plan. Corrective action must be done quickly (adjust capacity or changing the master schedule).
In MRP system, the functions of capacity planning and control are separated from the functions of priority planning and control. Priority planning is the task of the MRP system. Priority control is determined, for instance, on the shop floor by the use of a dispatching technique to sequence specific tasks on specific machines.
A few reasons I can think of why RCCP techniques are not used in some companies are: (1) data requirements are quite high - firm demand, forecasts, past data, lead times, utilization, products and process knowledge. (2) they don't have a stable MPS. If forecast and firm orders keep changing within week, and people bypassing agreed DTF and Planning Time Fence, capacity planning is a futile exercise. (3) they don't have the right skill, it is very time-consuming, or they are doing it the wrong ways.
All companies running MRP should implement capacity planning. Companies that have unstable master schedules can also be due to inadequate Safety Stock at the MPS level (besides orders and forecasts push in and push out, human errors, etc). The inadequate safety stock can be due to a poor demand forecasting or failure to measure Forecast Error. In turn, safety-stock level can provide protection against forecast error. For capacity planning process to be effective, we must make sure that there is adequate safety stock level, improving forecast error, and a stable master schedule (as I said, frequent last minute schedule changes are very expensive).
Determining the
Resource Profile
For this section, let's assume a lamps manufacturer I call it
Johor's Lamps. Johor's Lamps
runs 3 shifts, 120 hours per week from Monday to Friday; Planned
Production Lost Time per shift (change shift & rest time) is 35 minutes,
and company allows a maximum overtime of 10% of per shift either during
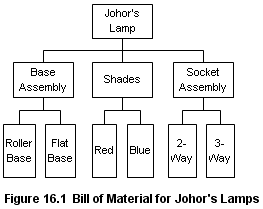
weekdays or through Sat. & Sunday. Figure 16.1 below shows its bill
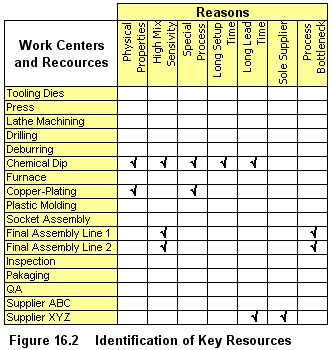
of material used for all product families. Figure 16.2 is the worksheet
matrix that is used to identify the key work centers, production lines,
and other critical resources needed to support the master schedule. Once
you complete the resources matrix, you should find out if any of the key
resources identified can be combined so you can reduce lead times.
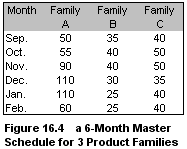
Figure 16.4 is the master schedule for the 3 product families derived
from sales & Operations Plan. You can read in detail in the
Master Scheduling section where I have explained the
development of an MPS.
 |
 |
 |
 |
 Figure
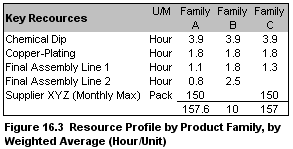
16.3 shows the standard time for each key resource by product family.
Standard Time refer to Setup time and Run time
(processing time) which impact the workload on a resource because it
actually tie up that resource. This is different from Queuing time,
Waiting time, and Move time which impact the time it takes
to move through the work centers; and they do not affect the load on
resources. So you should only include them as a small minimum percentage
when you are testing the feasibility of the master schedule - this is
because production can always split into smaller lot sizes, as well as
expedite in small batches, thereby cutting down the times in queue, wait
and moving the parts between work centers.
You should use
Weighted Average (using
SUMPRODUCT formula) instead of a
regular Average standard time when creating resource profile. For
example, standard time for a key resource should be the sumproduct of
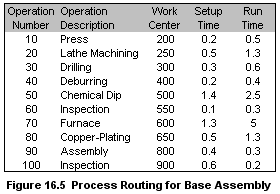
total setup time + run time (from Figure 16.5 Routing file) and the sum
of production output for an individual product family, divide by sum of
production output for that individual product family. You can either use
historical output for each work centers or using MPS volume. Use the
same way to calculate standard time for the rest of the key resources.
If engineering team has regularly updated process routings, setup times
and run times, using this method can be quite accurate in developing the
predictive resources profile. Once you are done, you should have a
Resource Profile something like in Figure 16.3. You also note that Final
Assembly Line 2 does not run product family C, and also supplier XYZ
doesn't supply material for product family B.
When using process routings sheet and BOM to create the Resource Profile, it is better to use this formula:
| Required Resource Time = |
(Run Time x BOM qty) + (Setup Time x
number of Setups required) + margin % of total non-standard times |
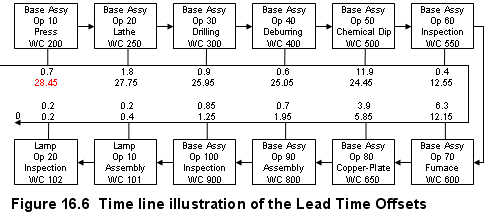
We also need to determine Lead-Time Offset, which is the time between the need for the resource and the date that the product has been promised. Lead-Time Offset is necessary if a product has longer lead times. Figure 16.6 illustrates a time line of the resources identified through the process routing for the critical Base Assembly. It shows that the longest lead time needed for the base assembly is 28.45 days, so the lead-time offset for this resource is about 29 hours prior to the completion of the lamp assembly. Every resource has its lead-time offset, but practically if the offset is less than 30days, you don't need to consider it when evaluating the validity of the production plan. In this case, even if you rough-cut master schedule and plan production on weekly basis, 29 hours is well within one week.
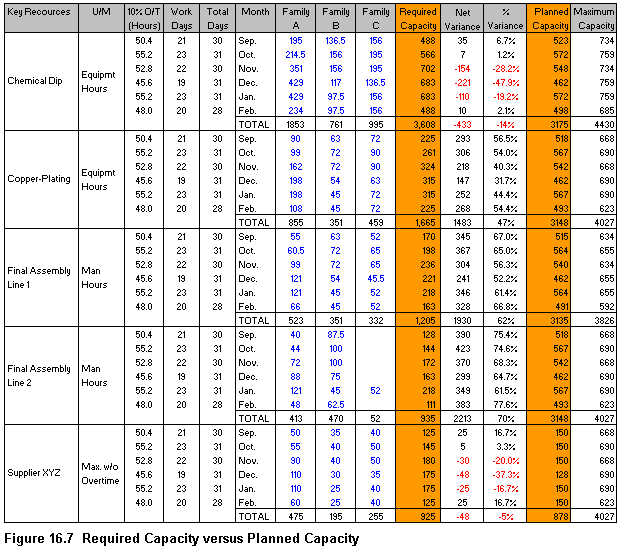
Now, with the key resources profile ready at hand, Johor Lamps want to validate the master schedule for the next 6 months, to verify whether there is adequate capacity at all key resources to meet the production plan (Figure 16.7). Of course, assuming there's a stable MPS. The technique involves comparing a machine-load report of required capacity to planned-available capacity at each work center. Here we need to understand there are several types of capacities being used.
Demonstrated Capacity
This is the proven or historical capacity of a key resource or work
center. Demonstrated capacity could potentially change if resources are
added or if operations are altered. In such case, adjustments to planned
capacity must be considered before making evaluation of the production
plan.
Planned Capacity
This is demonstrated capacity plus or minus anticipated changes or
adjustments to the product-flow process. For example, a production line
has a regular demonstrated capacity of 400 units/month, an upward
adjustment to 450 beginning sometime in the next few months might be
reasonable if additional operators or equipment is expected to be
available.
Maximum Capacity
This is the maximum load a resource can handle under any reasonable set
of circumstances. This can be achieved through several means: use of
available overtime, adding shifts, staff additions, offload volume to
outside vendors, pay extra for supply priorities, paying premium
freights to expedite materials delivery, etc).
Determining Capacity
Available or Planned Capacity
Since Johor's works 3 eight-hour shifts each day and there are 21
working days in Sept, it might seem that the capacity available to, for
example the Copper-Plating department, is 518 hours per month (24
hours/day/equipment less 1.75 hours of change-shift-rest time/day, times
21 days in Sept). However, there should be an adjustment between the
standard time and the actual average production rate of that department.
The first adjustment factor is known as Utilization. Utilization
is a number between 0 and 1 which is equal to 1 minus the proportion of
time typically lost due to machine breakdown, labor shortage, parts
failure, or material unavailability. The second adjustment factor is
known as Efficiency. Efficiency is defined as the average of
standard hours of actual production (after minus the unavoidable lost
time - setup time, change shift, rest time). If a time standard is
exactly right, efficiency is 1. If the time actually required to perform
the work is less than the standard, efficiency is more than 1. If the
time actually required to perform the work is more than the standard
time, efficiency is less than 1. See another
example on Utilization and Efficiency.
Capacity available is determined by multiplying time available x utilization x efficiency:
| Capacity Available = Time Available x Utilization x Efficiency |
The Resource Profile Technique
Resource Profile technique uses detailed data on the time
standards for each product at the key resources. A Time Standard
is the time it should take an average worker working at a normal pace to
produce one unit of an item. The time standard for any part has built
into it an allowance for rest to overcome fatigue or unavoidable delays,
etc. Because production processes are continually improved, time
standards become less reliable unless they are being updated. For this
reason, you should not use time standard that is two or three years old
to perform capacity study. However, poor standards are not an absolute
barrier to capacity planning; you can use an adjustment factor known as
“efficiency” to correct for outdated time standards (although
efficiency is not intended to reduce the need to keep time standards
updated). The detailed Resource Profile approach also requires standard
times data, and additionally, lead times required to perform certain
tasks. The results of RCCP using the Resource Profile approach for Johor
Lamps can be developed as this example shown in Figure 16.7 below. The
computations are in the worksheet available for
download. At one glance in Figure 16.7,
you can see that there are Overloads at Chemical Dip and also for
supplier XYZ in the same month of Nov, Dec and Jan. The Required
Capacity in the these 3 months exceed the Planned Capacity as indicated
by the negative Net Variance (in red fonts). The same situation happens
for supplier XYZ. The projected Underloads are especially serious
throughout the six months in Copper-Plating, Final Assembly Line 1 & 2,
ranging from 40% to 78%. If you look at the total % variance for these
three key resources, there are projected schedule overloads of 47% in
Copper-Plating facility, 61% in Final Assy Line 1, and 70% in Final Assy
Line 2. Note that the Planned Capacity has already included the Maximum 10%
overtime that is permitted.
This technique is designed to convert the master
production schedule from units of end items to be produced into the
amount of time required on the key resources. Resource Profile
approach considers lead-time offsets. Unlike other techniques, it
does not assume all components are built in the same time period as the
end item; it time-phases the labor and lead time requirements. In
some instances, RCCP may reveal that key resources are presently
inadequate and that expanding the resources requires more time or more
equipments than the company is willing to invest. In these instances,
the MPS must be revised. Resource Profile technique is the most detailed
rough-cut approach, but is not as detailed as Capacity Requirements
Planning.
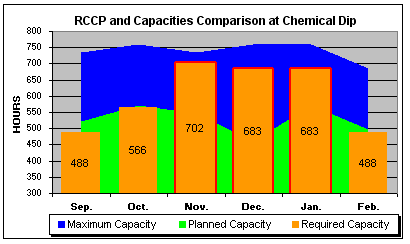
This graph on the left is plotted on
the Rough-Cut at Chemical Dip. It
clearly shows the three troubled
months (Nov through to Jan) with
production plan overloads.
Now, what can you do about the rest of production planning after reviewing the results from this rough-cut capacity analysis over the 6 months period? Well, before making any changes or take actions, you need to do another rough-cut analysis, this time at the master schedule level. Companies that have varied mixes of products are especially compelled to do this. RCCP at the master schedule level use the same logic as rough cut at the production plan level, only difference is the calculations are extended down one or two additional levels. The master schedule is "exploded" through the Resource Profile to generate the required capacity to meet the master plan.
Let's look at one month, Nov, to analyze projected capacities on a weekly basis, at the Overload resource - Chemical Dip. Figure 16.8 shows the quantities scheduled for each master schedule item. Note that the totals are the same as in Figure 16.4 Nov's totals, but clearly this 2nd-phase MPS rough-cut yields more detailed information, since it is at the component items level. The difference here is that the product families volume are broken down into component totals for the month, and analyzed on a week-by-week basis. To do this, take the quantities for each master scheduled item, multiply by the time requirements in the resource profile. (you need a SUMPRODUCT formula). All formula are in the worksheet for download. These component items are from the forecast, firm planned orders, and booked orders.
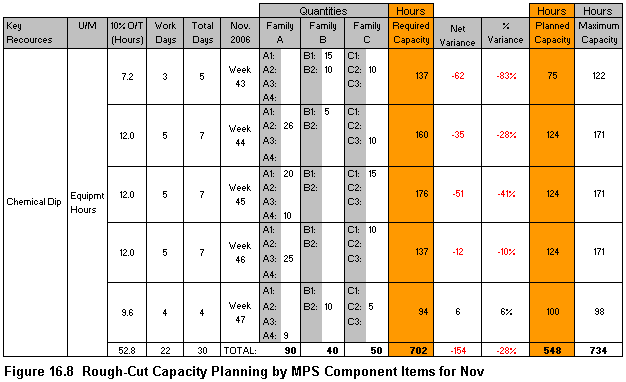
Before we proceed further, we may want to set some guidelines pertaining
to the % variance in Figure 16.8. It would seems logical to accept that
if the required capacity is :
●
no more than 10%
greater than the planned capacity, the master schedule is considered
realistic.
●
more than 20% greater than the
planned capacity, the master schedule is considered unrealistic.
●
between 10% and 20% greater than
the planned capacity, the master schedule is questionable. Need to find
out more information about the resource; ask the staff who have worked
long enough in that resource department, you will be surprised they can
give you a lot more accurate information.
Of course, in other industries and different environments, these guidelines may need tighter tolerances, say, 5% to 10%. Implement necessarily as you can deem fit.
For November, week 43, 44 & 45 in Figure 16.8 have revealed serious overloads even though the planned capacity has already included the max 10% overtime allowed. What causes it and what can be done? It might be possible to assign the workers from Final Assembly 2 Lines where underloads are projected, to help in the Chemical Dip department for the first 4 weeks in Nov. Splitting lots might helps to reduce some waiting time. It also might be possible to shift some of the volume from Nov 1st week to Oct where there is a little excess capacity. Of course, any decision of moving in or shifting out a master scheduled item requires consideration of the impact of that move on the ability to meet the customer promise dates. As a last resort, you can either tap into the maximum capacity which has included the 4 weekends, or sub-contracting out some of the load to approved vendors. Using the same calculations and analysis, you can extend to cover the rest of the key resources to have detailed view of all the MPS items and take appropriate corrective actions.
In many of today's ERP systems, there is also a "What-If" scenarios analysis capability being built into the capacity planning module, that makes it possible for the scheduler to juggle the numbers - shifting workers, reschedule in and -out, alternate routings, splitting lots, add equipments, off-loading to vendors, overtime, hiring temporary workers and so on.
Revising the
Master Schedule
Most companies consider a revision to the MPS to be a solution of last
resort in the event of insufficient capacity, and to be implemented only
when all other options are exhausted. Actually this is not entirely true
and logical. A number of things can cause an order to be expedited. An
order is rarely de-expedited. There may be several orders on the
existing master schedule that no longer are needed as early as the
current due date shows them to be needed. It is not uncommon to find a
machine-load capacity planning report that shows too much work in the
first two or three periods, but ample capacity beyond that. This problem
may be corrected or alleviated merely by people honestly putting the
"true" need date on all orders.
If de-expediting, overtime, subcontracting, alternate routing, and shifting personnel collectively cannot provide sufficient capacity, MPS revision does in fact become the technique of last resort, It is important to understand that when an unavoidable capacity overload exists, it must be corrected. If insufficient capacity exists, it is impossible to complete all orders on time. The choice now is to have management decide whose order will be late based on the impact on the whole business.
Next Page >>
Detailed
Capacity Requirements Planning