About Me
Excel VB Programming (VB6)
Excel Spreadsheet Formulas
Excel VB.NET Programming
Access Programming (2003)
Material Management
Master
Scheduling &
Production Planning
![]() Master Scheduling At
Work
Master Scheduling At
Work
Master Scheduling
Why we
do need Master Scheduling?
Master Schedule is a set of planning numbers that drives the MRP. It
represents build plan that includes all the individual product families,
expressed in specific configurations, quantities and dates. It takes
into account the forecast, SO&P's aggregate production plan, customer
orders, projected available balances, Available-To-Promise, backlog,
availability of material, the planned and maximum capacity, management
policies and goals. We need master scheduling to plan and commit
resources to meet customer demands, guiding against excess inventories
and backlog. Basically it is balancing supply and demand by discrete
time segments - daily and weekly. Most importantly, Master Scheduling
ensures integration and implementation of the sales, manufacturing,
finance, engineering, procurement, and logistics plans, that would
promise product deliveries and continual profitability of the company's
business.
Because actual demand does fluctuate from period to period, production can not always run at constant rates. So instead of being a constant maximizer on customer service level and plant utilization, and a minimizer on inventory and all the associated costs, a master scheduler will be coordinating and optimizing all the internal and external resources, in order to balance the conflicting situations in demand and supply. But how exactly does the master scheduler smooth out the peaks and valleys of demand while keeping the master schedule in balance? Below are some choices:
■ Use of
Safety Stock Level,
Re-Order Point
and Lot-Sizing strategies.
■ Use of overtime, offloading work by subcontracting out or in-sourcing,
adding or cutting down shift, personnel or equipment.
■ Offer price breaks for customers willing to delay deliveries due to
our cumulating past-due orders.
■ Varying the lead times when quoting delivery dates to customers, in
order to prioritize orders.
Examples of a Poor Master Scheduling
The telltale signs of a badly coordinated master scheduling
are such as:
– frequent schedule changes causing disruptions on the shop
floor
– unplanned overtime and late off-loading to outside processing
–
over- or under-utilized resources
– lack of capacity study (at least to
Rough Cut production plan and master schedule)
– high Work-In-Process
– long queues of late-start work orders
– late issue of purchase
orders
– late release of work orders
– missed material delivery due dates
from suppliers
– missed shipment dates
– increasing past due orders
–
misdirected efforts from use of hot list or constraint parts list (used
as a priority setting mechanism due to frequent part shortages from both
manufacturing and suppliers)
– demand forecast errors that build either
too much or too little
– inaccurate bills-of-material and inventories record inaccuracies
– end-of-month scrambling to meet shipment targets, and so on.
Dangers of an Overloaded Master Schedule and the solution
Companies that always carry past-due orders into the next period not
only will create a past-due MPS, but also overloading master schedules
that in turn create many other problems. Examples such as critical
material stockout, partially built products forced to take offline,
de-kitting in order to reschedule orders, high WIP, missing critical shipment dates, price concessions to angry customers,
costs go up due to overtime, expedited material purchases and air
freight, budgets blow up, stressed-out buyers and planners working
overtime to coordinate the overloaded materials and production
scheduling, etc - all continue to plague the companies, which now have
an uphill task to catch up.
Why do we allow the master schedule to be overloaded? Very often, the cause and answer come down to work behaviors where close coordination, team work and trust are absent. If Production is always late or run short, or stockroom always has not enough in-stock qty to fulfill an order, Sales and Account teams will have tendency to inflate the forecast volume, or move the orders up in the schedule (the later causes some promised orders to be pushed out due to another product being rescheduled into their committed time slots). It is a natural response that explains why they deliberately overloading the schedule - to ensure enough units will be built and be made available earlier. When actual orders don't happen, scheduler and planners will learn the game and begin discounting orders as they appear. Avoidance and denial of the problems in this atmosphere of distrust, becomes the course of least resistance. Often, the attitude is: "sweep it under the carpet", park it at someone else's "door", or park at no man's "land".
The manager needs to make people admit to their problems and past mistakes, and make them agree to a list of operating guideline. Then, the next step toward dealing with an overloaded master schedule is a top-down analysis of the following:
■ List down the action priorities from Sales (eg.
incorrect SO dates), Planning (eg. incorrect item in Production Order), Purchasing
(eg. past due delivery dates) and Production
(eg. undeclared scraps or wrong unit consumption rate), along with
owner names and expected dates of completion.
■ To reschedule priority Purchase Orders with suppliers and outside
process vendors, making sure no "disconnecting" dates between
each manufacturing process.
■ To reschedule allocation of production resources to most aging
or most important customer orders.
■ To reschedule production with completion dates that are realistic.
■ Stop taking new order into a recovery time slot, but promise a date
where all Past Due's are scheduled to clear.
■ Avoid accepting new orders at short lead time that would increase the
chance of missing other orders (use ATP and realistic lead times).
■ Establish a strategy and plan of how to get out of the over-scheduled
situation (overtime, outsourcing, adding shift and equipment, etc),
monitor and measure its success.
As you can see, guarding against an overloaded master schedule, is never easy but requires close coordination with all the other functions of the company, in order to get the demand and supply back into balance.
The relationship of MPS
to RCCP and MRP
To understand where exactly master scheduling fits in, see
Figure 8.1 on the MRP page.
The master scheduler has to create a detailed plan in terms of individual product configurations, quantities and required dates, in order to meet the demand requirements mapped out in the aggregate production plan, developed during the Sales and Operations Planning Process (SOP). In developing that schedule, a capacity study must be made. Most companies use only the Rough Cut Capacity Planning (RCCP) to do this, which is a sanity check on the feasibility of the MPS against planned quantities and dates, availability of equipments, shifts, labor hours, cumulative lead times and other key resources. The objective is to identify any potential bottleneck operations that may disrupt the master schedule. If the master schedule is not feasible at this stage, it should be adjusted. Any serious capacity problems identified should be relayed back to the aggregate production plan to reconcile.
Once a feasible Master Production Schedule (MPS) is confirmed, the numbers are input into the ERP system; then the master scheduled items are "exploded" through Material Requirement Planning (MRP) using bills-of-material, to determine the gross requirements for all the lower-level items to support the MPS scheduled receipt. The output are the MRP's Computer Planned Orders (CPO) for master scheduler/planners and Purchase Requisitions for buyers to act upon. Combining the close coordination of master scheduling, capacity planning, suppliers scheduling and execution, will ensure that the required materials and capacity to produce the planned items are available at the right time and in the right quantities.
How Master
Scheduling works?
To manage the imbalances in supply and demand in time segments
necessitate the need for MPS matrix. The format of MPS matrix depends on the
choice of ERP software that you have. Figure 15.2 below shows you just how the
MPS and MRP matrices are linked in the ERP software. It also illustrates to you
the integration of Safety Stock, Planning Time Fence (PTF), Demand Time Fence
(DTF), how Action Exception Messages are created, rescheduling Time Zones, as
well as all the components of demand and supply in the MPS and MRP matrices ―
Independent and Dependent Forecast, Actual and Total Demand, Projected Gross
Requirements (PGR), Projected Available Balance (PAB), Available-To-Promise
(ATP), MRP's or Computer Planned Order (CPO), Firm Planned Order (FPO), Planned
Order Release (POR), and Scheduled Receipt (SR) which is often used
interchangeably with the terms Released Order, Work Order, Production Order, Job
Order, and Purchase Order (if it is a purchased item).
Let me explain all the terms that defined the scheduled activities before we go to understand the flow of master scheduling illustrated in Figure 15.2.
Time Segment
The number of periods is dependent upon the company's choice of planning horizon. Each period could represent a day or a week.
Item Forecast
This is a forecast number that identifies the independent demand for the master scheduled item. An example would be an item that can be sold by itself and sold directly to the customer.
This is a forecast number that reflects the anticipated demand for an item that will be sold as part of some products. For example, an anticipated sale of a service spare part, or a motor for a chiller assembly would constitute a dependent demand.
Total Demand
It is the sum of Item Forecast, Option Forecast and Actual Demand. If, however, the forecast is not replaced with booked customer orders, then the Total Demand should exclude that forecast number which is in a process we called Forecast Consumption. However, it really depends on your company policy or the Forecast Consumption rules, whether a past due forecast or an unconsumed forecast be dropped or to roll forward. If the booked customer order was not part of the original forecast and it is treated as an Incremental Demand.
Master Schedule (MPS)
This is the row where supply orders (quantities and due dates) will be placed by
the master scheduler and the MRP. Master Schedule supply orders consists of the
MRP's Planned Order, Firm Planned Order, and Released Order (or Work Order).
Released Order (RO) or Scheduled Receipt (SR)
Other aliases are Work Order, Manufacturing Order, Production Order, or
Purchase Order if it is a purchased item. Work Orders initiate the production
process by authorizing material, labor, and equipment to be used to manufacture
specific products. Released Orders are not exploded via MRP because they would
double create lower-level allocations for materials, and would be treated
similarly as the demand on the materials contained in the FPO's bill-of-material
until that material is issued according to the build plan.
Firmed Planned
Orders (FPO)
FPO is a supply order that the master scheduler places to take control away from
MRP. It is a place-holder that allows the master scheduler to firm a computer's
planned order in qty and time. ERP system is restricted from changing the FPO,
but is the scheduler's responsibility to change it. Once the scheduler creates
FPOs that balance supply to demand, MRP will not attempt to create additional
supply orders because they won't be needed. FPOs with the bills-of-material are
then exploded through MRP to plan materials and capacities.
Computer Planned Orders (CPO)
CPO is a supply order created by MRP system, not by master scheduler. It serves
as a suggestion telling that a Firm Planned Order of an indicated size would be
needed if demand and supply are to balance. The scheduler must convert the CPO
into Firm Planned Order, or convert directly into a Released Order. MRP bases
its creation of CPOs on Demand Need Dates, Projected Gross Requirements, Safety
Stock, On-Hand Balances, predetermined Lot Sizes, and Lead Times to ensure that
the release and production or purchase of material will meet the demand need
date. CPO creation rules are controlled by Planning Time Fence.
Planning Time
Fence (PTF)
It is a date-related boundary that allows MRP system to create CPOs with due
dates after predefined dates, and not before. Within the planning time fence,
the master scheduler take complete controls all the supply orders. By operating
with in planning time fence, MRP system knows when it can or can not place a
CPO.
Projected
Available Balance (PAB)
It calculates what will be in inventory at a specific of time. If a company
doesn't use Safety Stock, the perfect supply-demand balance will be a projected
inventory balance of zero. That means a positive PAB for any period of time
would suggest a potential surplus or excess stock condition. A negative PAB
means the system is projecting a potential shortage. In the case of a potential
surplus, MRP may recommend to move supply orders out, cancel some, or cancel all
altogether. In the case of potential shortfall, MRP Exception Messages may ask
to release new supply orders or move future supply orders in to cover the
projected deficit.
PAB = (On-Hand Balance + Scheduled Receipt) - Projected Gross Requirements
Projected Gross
Requirements
This is a row in the MRP matrix that
represents demand for the master scheduled item in the MPS matrix (not from
customer orders).
Available-To-Promise (ATP)
This is the uncommitted inventory balance, maintained in the master schedule to
support customer order promising. ATP qty in the 1st period equals On-Hand
Balance less the Actual Demand that are due and past due. ATP tell the sales
manager and demand planner of the products that how many more can still be sold
without modifying the current master schedule. In any period containing MPS
scheduled receipts, ATP qty equals MPS less Actual Demand in this period and
all subsequent periods before the next MPS Scheduled Receipt.
Action Exception
Messages
An output report from MRP that identifies the need for and type of corrective
action to be taken to address a current or potential problem. Examples are: to
release orders, to firm planned orders, reschedule in, reschedule out, cancel
orders.
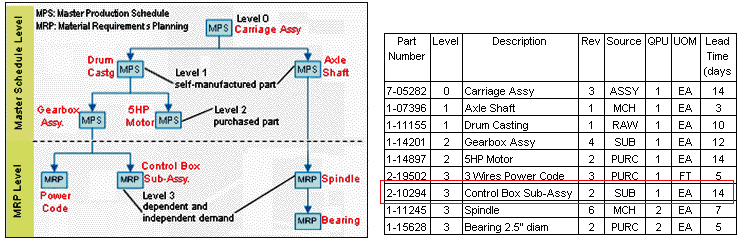
Figure 15.1 Multi-Level Bill-of-Material showing the Master-Scheduled items and MRP-Level items
For illustration purpose, I pick a Level 3 BOM item, Control Box, which is controlled at MRP level. Figure 15.2 will then show you how the master scheduled Level 0 Final Assembly links to this Level 3 MRP item, and how MRP calculates and display the Projected Gross Requirements and Projected Available Balance. If you want to see all the calculations in Figure 15.2, 15.3 and 15.4, you can download this worksheet.
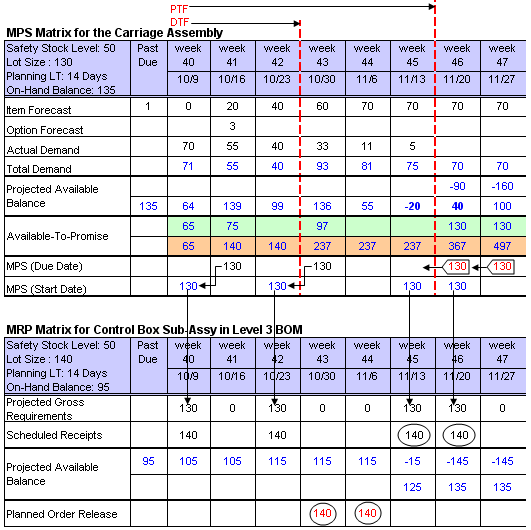
Figure 15.2 Linking Master Schedule to MRP, and showing how Safety Stock Level, Planning Time Fence, Demand Time Fence and Action Exception Messages integrating MPS
With the MPS and MRP matrix, it tells straightaway when supply and demand are in or out of balance. Here the Time Segments are in week, 10/9 being the current period, week 40. Some Master Schedules can extend up to 24 months. Notice that there is a past-due demand or unconsumed forecast of 1 unit, and for this exercise I let it rolls forward to current week. Several planning parameters are set for this MPS item - safety stock level 50 units, lot size 130 units, lead time 14 days.
Linking MPS to Material
Requirements Planning
For illustration purpose to show how
MPS and MRP are linked, I used the last 2 rows in MPS matrix to show the master
schedule by Due Date and Start Date. There are 4 Scheduled Receipts of 130 units
with due dates in end of week 41, 43, 46 & 47 to meet the anticipated demand.
But there are still imbalances as you 'll soon see. For this example, let's
continue with the supply orders for week 46 & 47 before the master scheduler
makes changes.
The supply orders in week 41, 43, 46 & 47 of the master schedule are shown to trigger respective Projected Gross Requirements for the same qty one period earlier in the MRP matrix (MPS quantities by Due Date and offset by planning lead time to the Start Date). Note that the Projected Gross Requirements row of the MRP matrix represents demand for the master scheduled item in the MPS row (Carriage Assy), not from the final customer. Taking the lead time into account, MRP places the demand requirement of 130 units in current week 40 of the MRP matrix for the Control Box Sub-Assembly in level 3 BOM. The same process repeats itself whenever a Supply Order appears on the MPS row of the Master Schedule.
MRP calculates the Projected Available Balance (PAB) in the same way as does the MPS system (see the next example down). The Planned Order Release row shows the equivalents of the Computer Planned Orders (CPO) that work in the MPS system. It is the row that MRP attempts to deal with any potential supply shortfalls that appear in the PAB row. For example, to avoid a PAB shortfall (-15) from developing in week 45, MRP will recommend a CPO in week 45, and therefore it must be released in week 43 (because lead time for Control Box Sub-Assy is 2 weeks). The same for a CPO to be released in week 44 due to a PAB deficit in week week 46. After checking that there are no material and capacity issues, the scheduler/ planner will convert the CPO into a Scheduled Receipt (Released Order, Work Order or Production Order) when week 43 becomes the current week (preferably the 1st work day of week 43). Once the CPO is converted into a scheduled receipt, it will be automatically be deleted during MRP next run.
Lower-level BOM requirements (so is this level 3 item, Control Box) are maintained when MRP runs through the multi-levels BOM and creates allocation for each lower-level item required to support the scheduled receipt (level 0, Carriage Assy). The Projected Gross Requirements (demand), Projected Available Balance (supply), and Planned Order Release (supply) are calculated by MRP system; only the Scheduled Receipts are maintained by the master scheduler.
In situation when the PAB goes negative and then returns to positive, MRP recognizes that a timing problem exists (that is, there is enough supply orders, but just some of them are scheduled too late). In another situation when the PAB goes negative and stays negative, MRP recognizes that a volume problem exists and will recommend additional supply orders. Each time that MRP is run, this kind of analysis and calculation take place in the system and Exception Messages Reports are generated for scheduler/planers to take action. So in such calculation analysis, MRP would not recommend that the Computer Planned Order be released until we enter into week 43.
Calculating Projected
Available Balance
For the master-scheduled item, 135 is the Beginning On-Hand Balance. 135 plus
the Supply Orders or Scheduled Receipt in the MPS row (equals 0) in current
week, minus the Total Demand (70+1) in current week, that gives the Ending
Projected Available Balance (64) for current week. The projected available
balance for week 40 through 47 are calculated the same way. There is a potential
shortfall of 20 units to meet the expected demand (75) at end of week 45. But as
you read down, you will understand how MRP and master scheduler attempt to
resolve these supply-demand imbalances.
Calculating
Available-To-Promise
The first step is to take what is master-scheduled and subtract the commitments
(orders booked but not yet shipped). Because forecast is not a commitment, it is
generally dropped in the
ATP
calculation. Working from right to left from week 47 in Figure 15.2,
130 are master scheduled, and 0 are committed (no actual demand), so ATP is 130
(130 - 0 =130). Using the same calculation, ATP in week 46 is 130, week 43 is
97, and so on.
The Green row shows non-cumulative ATP qty, and the Orange row shows cumulative ATP. To calculate a cumulative ATP or carry over the values, simply add the ATP from each period working left to right. Why do I do that? For example, if a customer calls and asks you how many Carriage Assy you can give him by week 47. At a glance on the ATP row, the answer is 497.
Because of the projected on-hand shortfall of -20 in week 45, and expected it to also fall below the safety stock level in week 46, the master scheduler has moved the 2 supply orders of 130 lot size up a week earlier to week 45 and week 46, to overcome the supply shortfall. Figure 15.3 shows you, after MRP recalculates, that ATP in week 46 and 47 was now made available a week earlier. Week 45's ATP shows 125 because of the Actual Demand of 5 (130 – 5). The positive projected available balance in week 45 now shows no more supply deficit.
Figure 15.4 shows that the company has secured a huge booking and actual demand for week 45 has increased from 5 to 137 units. Since 130 units are master scheduled in week 45 and 137 have been committed, the resulting ATP is – 7 (130–137). Negative values in ATP are substituted with zero, and ATP in week 45 will become zero (the total master schedule in week 45 is consumed). To protect the entire commitment of the 132 units increase in demand, MRP will look at week 44 which has 237 ATP qty, while at the same MRP also suggests through Exception Message, to create supply order of an additional lot size in order to cover the the negative projected on-hand balance (-22) in week 45. By taking 7 out of the ATP 237 units for week 45 coverage, ATP would remain 230 in week 44. By working back into time, from week 45 to current week 40, the scheduler/demand planner can use ATP to protect customer orders promises without committing current inventory any earlier than necessary.
Checking that there are enough material and no capacity constraints, the master scheduler acts on the Exception Message to create an additional Firm Planned Order of 130 units into week 45. As shown in Figure 15.5, the Scheduled Receipt becomes 260 in week 45, and there are now no more projected on-hand shortfall as well as none falls below the Safety Stock Level in all the 8 weeks.
Managing Safety Stock Level
In SAP, you enter the desired safety stock values,
and system flags any situation in which the projected on-hand balance falls
below the safety stock level. In the MPS matrix, safety stock level is
maintained at 50 per period. At a quick glance in Figure 15.2 tells you
that in week 45 & 46, the projected available balance is expected to fall below
the safety stock level or turns negative (40 and -20). The expected available
balance of -20 in week 45 [55 + MPS (equal 0) - Total Demand (75)] happened
because there is no schedule receipt in week 45.
But why no? The master scheduler has placed a Planning Time Fence at end of week 45. By doing this, the master scheduler can control all the supply orders up through week 45, while MRP can only add or make changes beyond week 45. With a cumulative lead time of 6 weeks, the master scheduler wants these periods "locked up", and not subject to some insensible changes recommended by MRP to balance out a deficiency in some other period without a more careful human analysis. Therefore, MRP can only place a Computer Planned Order (CPO) of 130 in week 46, but not in week 45. However, MRP outputs the Exception Message Report to the scheduler to shift the week 46's CPO of 130 into week 45, and convert it into Firm Planned Order (FPO). This is indicated by the arrowed box in Figure 15.2. Using the same logic, MRP also indicates in the Exception Message to move the week 47's CPO of 130 to week 46 because the week 46's projected available balance (40) falls below safety stock level. These shifts would keep the projected available balance above 50 in all the 8 weeks as shown in Figure 15.3.
Company has booked an increase in demand for week 45 by an additional 132 units (137–5) as shown in Figure 15.4. This cause the projected available balance for week 45 through 47 to fall below the Target Safety Stock Level (-22, 38 and -32). As MRP is restricted from creating a supply order in week 45 (inside the planning time fence) to address the PAB supply deficit of -22, so MRP suggests through Exception Message to the scheduler to create an FPO or Released Order of 130 as indicated by the arrowed box. There was no material and capacity issues, the master scheduler created and released an Firm Planned Order of 130 units into week 45. MRP recalculated, the Scheduled Receipt in MPS row now becomes 260 units in week 45 as shown in Figure 15.5, and the MPS matrix shows there are no more projected available balance that falls below the Safety Stock Level in all the 8 weeks.
Managing Planning Time
Fence (PTF)
In Figure 15.2, PTF was being placed at end of week 45. The purpose of placing
this planning time fence is to restrict MRP from automatically adding Computer
Planned Orders (CPO) within that specified time zone. Only Released
Orders and Firm Planned Orders can be created within PTF's close-in periods, and
the master scheduler controls this. MRP thus can only settle for placing enough
CPOs into week 46, to create a positive Projected Available Balance, and
informs the scheduler by means of Exception Message that a negative expected
on-hand balance exists inside the planning time fence. The master scheduler must
take action if the supply deficit in week 45 (expected on-hand shortfall of -20)
is to be avoided. This supply deficit would increase by 70 per week through the
planning horizon if no additional Firm Planned Orders (FPO) were placed
(supply shortfall of -90 in week 46, -160 in week 47).
Before the scheduler converts the CPO of 130 in week 46 into a Firm Planned Order, or directly into a Released Order with a due date in week 45, these things must be checked first -- ensure there are enough material and capacity to produce these 130 units in time, question the validity of the 70 units forecast, and who need to authorize to make this change.
Managing Demand Time Fence
(DTF)
A DTF is being placed at the end of week 42. Inside the DTF, demand will consist
only of Actual Demand (committed customer orders with promised dates); forecast
will be ignored between the current week 40 and the DTF. Outside the DTF, the
Total Demand will then equal actual demand + forecasts (depends on forecast
consumption technique used). For example, in Figure 15.2 you can see the
projected available balance for week 42 and 43 are calculated differently using
this DTF logic. DTF is strictly a mechanical means used to lock demand within
the specified near periods with only booked orders (forecast should
already more-or-less have turned into booked orders in current + next 2 weeks).
Any changes to the master schedule with the DTF need formal approval from
authorities higher than the master scheduler. Additional customer orders can
still be promised inside the DTF if there enough ATP quantities. Beyond the DTF,
the master scheduler can make changes to MPS, within the existing
rescheduling rules.
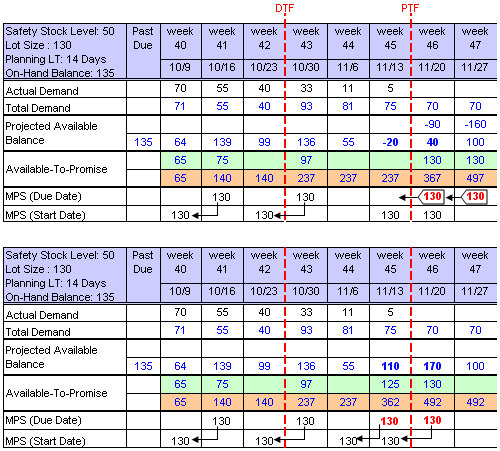
Figure 15.3 Improving Projected Available Balance and ATP after shifting in Supply Orders
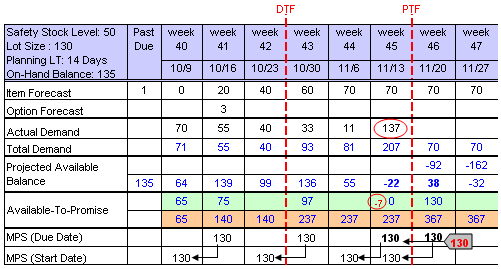
Figure 15.4 Recalculating Projected Available Balance and ATP after Increase in Demand
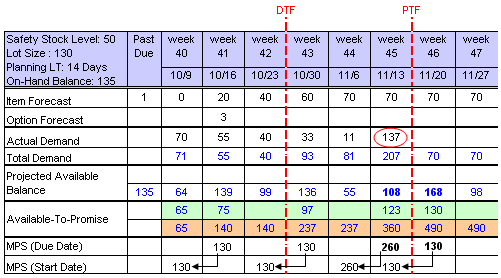
Figure 15.5 Recalculating
Projected Available Balance and ATP after shifting in incremental Supply Order
Next Page >> Master Scheduling in a Make-To-Order Environment